
**********On Friday (January 31st), spot gold traded at $2795.70 per ounce, with a slight increase of 0.02% during the day, reaching a high of $2800.80, showing a narrow range oscillation trend overall. The recent continuous rise in gold prices is mainly supported by rising risk aversion, the weakening of the US dollar, and inflation expectations. However, the hawkish stance of the Federal Reserve and the recovery of the yield of US treasury bond bonds have limited the further rise of gold prices. The following analysis will be conducted from both fundamental and technical perspectives.

Fundamental analysis: dual support of risk aversion and inflation expectations
1. Trump's tariff remarks raise market concerns
US President Trump recently reiterated his threat to impose a 25% tariff on Mexico and Canada, and warned that if BRICS countries attempt to replace the US dollar, they may implement a 100% tariff. This statement has intensified market concerns about the escalation of trade frictions, driving safe haven funds into the gold market.
2. Rising geopolitical risks
The situation between Russia and Ukraine remains tense, and the prolonged flights of Russian fighter jets over the Sea of Okhotsk and the Sea of Japan further exacerbate geopolitical uncertainty. In addition, the market's expectation that Trump's protectionist policies may trigger inflation also provides support for gold.
3. The hawkish stance of the Federal Reserve limits the increase in gold prices
At its recent meeting, the Federal Reserve decided to keep interest rates unchanged and hinted that it would not rush to cut rates before inflation and employment data hit targets. This hawkish position pushed up the yield of US treasury bond bonds and limited the attractiveness of gold as a non yielding asset.
4. PCE data becomes a key catalyst
The market is closely monitoring the upcoming release of the Personal Consumption Expenditures (PCE) price index in the United States, which is an important indicator for the Federal Reserve to measure inflation. If the data exceeds expectations, it may further push up inflation expectations, thereby boosting gold prices; On the contrary, if the data is weak, it may weaken the attractiveness of gold.
Technical analysis: The $2800 mark has become the focus of long short competition
1. Short term upward trend
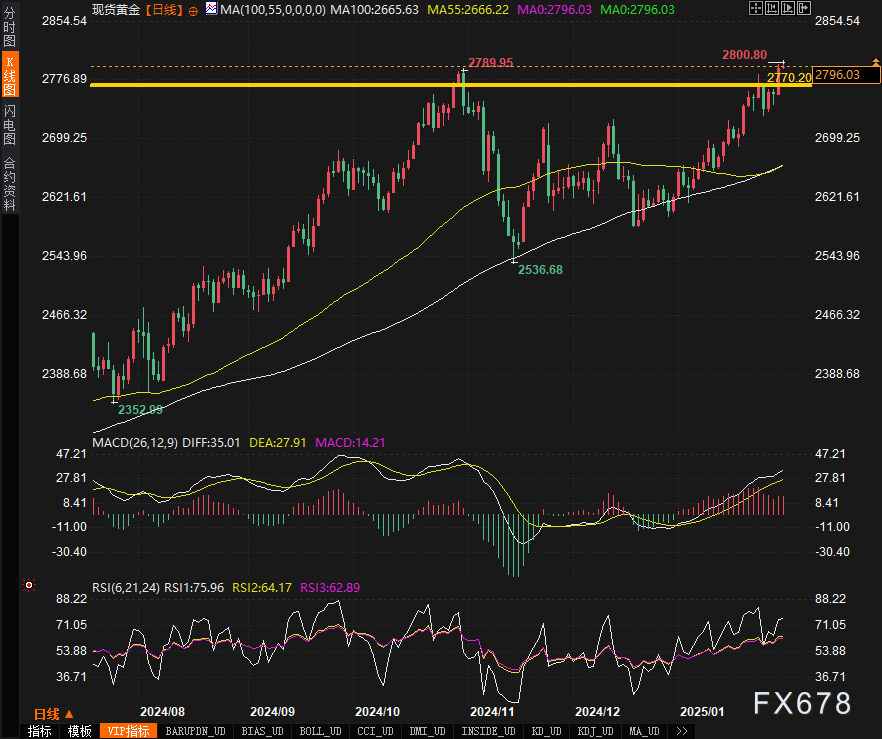
The price of gold has been continuously rising recently and reached a historic high of $2800 on Friday. From the daily chart, the gold price has broken through the key resistance zone of $2773-2772 and is attempting to stabilize at the $2800 level. If the price can effectively break through and stabilize at $2800, it may further open up upward space.
2. Key resistance and support
-Resistance zone: $2800 is a short-term key psychological barrier, and breaking it may test $2850 or even higher levels.
-Support area: The $2773-2772 range is an important support area in the near future, and if the price falls back to the vicinity of this area, it may attract buying in. Further support is located in the $2758-2756 range, and if it falls below, it may trigger long liquidation, and the price may drop to the key support of $2740 or even $2725-2720.
3. Technical indicator signals
-Relative Strength Index (RSI): The RSI indicator on the daily chart is close to the overbought area, indicating that the market may face short-term pullback risk.
-Moving Average: The gold price is currently above the short-term and long-term moving averages, indicating that the overall trend is still bullish.
Future Trends and Prospects
1. Upstream breakthrough scenario
If the gold price breaks through and stabilizes at the $2800 level, it may further test the $2850 or even $2900 level. The implementation of this scenario depends on PCE data exceeding expectations or further escalation of geopolitical risks.
2. Downward correction scenario
If the price fails to break through $2800 and falls below the support area of $2773-2772, it may trigger a short-term correction, with targets set at $2758-2756 or even $2740.
3. Horizontal consolidation scenario
Before the release of PCE data, the market may maintain a volatile pattern, with prices fluctuating within the range of $2770-2800.
summarize
The current gold market is at a critical juncture in the long short game, with Trump's tariff rhetoric, geopolitical risks, and PCE data becoming the main driving factors for short-term price trends. Technically speaking, the $2800 threshold and the $2773-2772 support zone are the focus of attention. Investors need to closely monitor fundamental dynamics and flexibly respond to market changes by combining technical indicators.


